Electric cars appear to be poised for a breakout year in 2022. Globally nearly 9% of cars sold last year were electric, up from 2.5 % in 2019 (Ewing & Boudette, 2022). This is against a backdrop of a shrinking market for conventional cars during the pandemic and its supply chain disruptions with all of the net growth attributable to electric cars. China led the global growth in electric cars last year with sales leaping from 7.2% at the beginning of the year to 20% at the close of the year. Overall, 17% of European car sales were electric in 2021 with significant variation across different markets: Norway at 77%, Sweden and the Netherlands at 45% and 30%, followed by the UK and France at 15% and Italy and Spain at 6.5%. The Chinese and European markets offer generous incentives and have stricter auto regulations (Paoli & Gul, 2022).
In the US, electric cars doubled their share to 4.5% in 2021. Tesla dominated the US market with 936,000 vehicles sold in 2021 (a 90% increase from 2020) and projected sales of 1,500,000 vehicles in 2022 (Paoli & Gul, 2022). The global auto industry is on track to invest $500 billion in the next 5 years to make the transition to electric vehicles. The money will be used to refit and build factories, train workers, write software, upgrade dealerships and more. Collectively these investments represent the biggest industrial transformation since the dawn of the automobile industry. (Ewing & Boudette, 2022)
This frequently asked questions guide seeks to answer some of the questions that one might have in assessing whether an electric vehicle might be a good fit in their future. It starts by outlining the rationale for the electric car transition from a climate change perspective and shows how it is being addressed at a government and industry level. It covers the vehicle models available today and in the near future including the overall driving experience, purchase cost, operating cost (fuel efficiency), and tax incentives. It further explains common electric car terms, (HV, PHEV, BEV, kilowatt, kilowatt-hours, MPGe). It contrasts the difference between electric vehicles and conventional vehicles with respect to emissions and fuel efficiency. It lists ranges for various models and explains the different charging options. It includes information on the safety of electric cars and lists planned improvements to the national charging infrastructure.
What is driving the transition to electric cars?
In two words, climate change. The burning of fossil fuels (coal, oil, and natural gas) since the beginning of the industrial age has increased the concentration of greenhouse gasses (primarily CO2 but also methane) in the atmosphere. A stable climate entails a balance between incoming sunlight and outgoing infrared radiation. Infrared-absorbing greenhouse gasses in the Earth’s atmosphere alter the details of this balance causing the Earth’s surface to warm until a new equilibrium is established between outgoing infrared radiation and incoming solar radiation. The UN Intergovernmental Panel on Climate Change has issued a series of assessment reports (the current issue is the 6th report). The current issue includes a Special Report on the Impacts of Global Warming of 1.5◦ (2.7◦ F) above pre-industrial levels and defines greenhouse gas emission reduction pathways that strengthen the global response to threats of climate change and promote sustainable development (IPCC Special Report on 1.5 C). Among the reports finding are:
- Human activities are estimated to have already caused 1◦ C (1.8◦ F) of global warming.
- Warming will persist from centuries to millennia
- Climate models project
Increases in mean temperature in most land and ocean regions, hot extremes, heavy precipitation, drought and wildfires
Mean sea level rise of 0.26 to 0.77 meters
Impacts on biodiversity and ecosystems, including species loss and extinction
Climate related risks to health, livelihoods, food security, water supply, security and economic growth
- Model pathways to limit global temperature rise to 1.5◦ C require human-related CO2 emissions to decline by 45% by 2030, and reach net zero by 2050.
- Pathways limiting global warming to 1.5◦ C require rapid and far-reaching transitions in energy, land, urban environments, and infrastructure (including transport and buildings) and industrial systems.
According to the inventory of U.S. Greenhouse Gas Emissions and Sinks 1990–2019, the transportation sector is the largest contributor to anthropogenic (man-made) U.S. greenhouse gases (EPA - Facts on GHG).
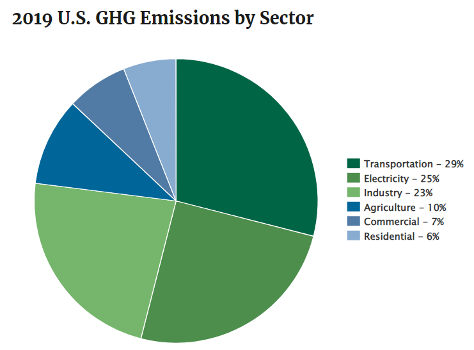
and light duty vehicles (sedans, SUVs, pickup trucks, etc.) makeup 58% of the transportation totals.
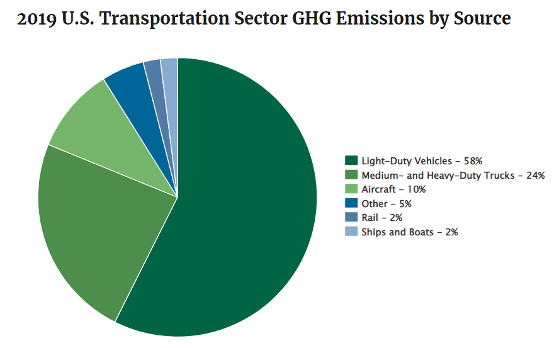
Any attempt to address climate change must clearly address this sector.
What has been government’s response to address climate change?
Globally - The Paris Agreement, an international treaty signed by the 196 nations on climate change, was adapted in 2015. It covered climate change mitigation, adaption, and finance (United Nations Climate Change, 2015). The Paris Agreement's long-term temperature goal is to keep the rise in mean global temperature to well below 2 °C (3.6 °F) above pre-industrial levels, and preferably limit the increase to 1.5 °C (2.7 °F), recognizing that this would substantially reduce the effects of climate change. Under the Agreement, each country must determine, plan, and regularly report on its contributions. No mechanism forces a country to set specific emissions targets. Although the IPCC’s latest reports (April 2022) show that the world is falling well short of the upfront investment and social change necessary to meet the Paris climate goals the rapid adaption of electric vehicles in 2022 and beyond is a bright spot in the overall picture.
U.S. Domestically – In line with the Paris Agreement, the Biden administration has set a goal for the United States to reach 100% carbon pollution-free electricity by 2035 (15 years earlier than the previous goal of 2050) (The White House GHG Fact Sheet, 2021). Decarbonizing electricity is essential to enabling decarbonization of the transportation sector by eliminating upstream emissions. A full transition to electric vehicles could increase demand to current generation capability by 25% to 40% (Plumber, 2021) (McKinsey & Company, 2021).
Building the necessary capacity while transitioning to renewable resources will require significant investment including improvements to transmission grids, grid storage, and EV charging infrastructure. On the positive side, the costs of renewable technologies such as solar and wind continue to decline and, in 2020, 62% of the installed capacity was cheaper than the most cost competitive fossil-fuel option (IREA, 2021). A federal Clean Energy Standard has been proposed to incentivize the building of a green grid. Tax credits and rebates would be given to utilities for expenditures related to adding solar, wind or other energy efficient resources - $300 billion has been proposed for clean energy tax credits but not approved (Harris & Schultz, 2022). However, the Infrastructure Law signed last year did include $73 billion to expand and update the electricity grid (Kelly, 2021).
Focusing on the automotive sector, the Biden administration has updated the Corporate Average Fuel Economy (CAFE) requirement such that every automaker will need its fleet of light duty vehicles sold in the U.S. to average 49 MPG by 2026 (Stafford, 2022). Additionally, the Biden administration has set goals that by 2030 (1) half of the new cars sold will be electric and (2) 500,000 electric chargers will be available to charge them (Davenport, 2021). The 2021 Infrastructure Law included $7.5 billion to support charger installation (Kelly, 2021).
What has been the auto industry’s response to address climate change?
As noted by in Motavalli in Forbes Wheels, “there’s no longer any doubt that the auto industry is going electric. Every international automaker is introducing battery cars, and plug-in hybrid options are increasingly part of model lines. But some auto companies have gone further, and actually set dates for when they will produce only ‘electrified’ cars (batteries and hybrids) and/or pure EVs. Others have set dates when they’re going to stop developing internal-combustion engines. Some have already stopped (Motavalli, 2021).”
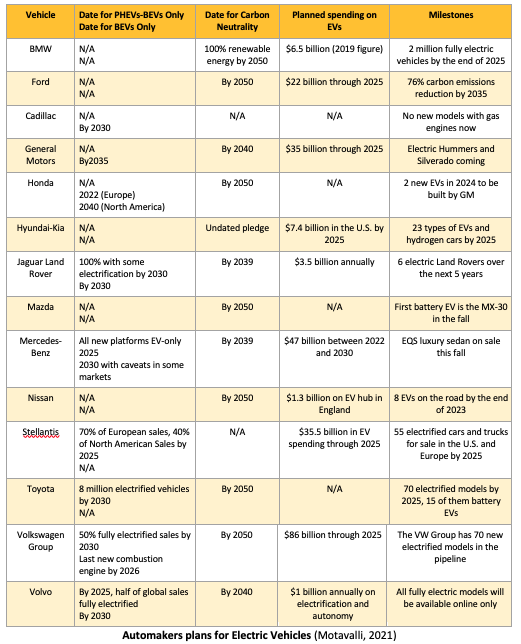
This chart does not include Tesla which has been battery electric since its inception nor does it include any of the electric vehicle startups such as Lucid, Rivan, Bolinger and Fisker.
What types of Electric Vehicles are available?
There are three levels of electrification – hybrid (HV), Plug in Hybrid (PHEV), and battery electric (BE).
Hybrid – Hybrids typically combine a relatively small gasoline engine, at least one electric motor and a small battery pack. The electric motor supplements the gasoline engine and allows the engine to shut off at low speeds and coasting. Regenerative braking lets hybrids recapture energy that would otherwise be lost to recharge the battery. Hybrid vehicles boost fuel economy but are not seen as a long-term solution.
Plug in Hybrid (PHEV) - PHEVs have a larger battery than regular hybrids. Regenerative braking is used to extend the cars range. The gasoline engine and electric motor switch back and forth as needed. Most can travel between 20-40 miles on electric power only. Because the battery is smaller, PHEVs can be recharged on a regular 120-volt outlet. PHEVs offer the range of a regular gasoline vehicle. PHEVs are seen as a bridge technology good through the 2030-2040 timeframe.
Battery Electric (BE) - A battery electric vehicle (BEV) relies on a large battery to power the electric motors. They forgo complicated mechanical parts such as an internal combustion engine (ICE) or a transmission. Because the batteries are larger, charging times are longer unless BEV-specific chargers are used. BEVs are very efficient with vehicle ranges typically greater than 200-300 miles. Driving long distances requires some extra planning on where and when to charge. Because BEVs are considered the long-term future of light-duty vehicles, most of the subsequent FAQs focus on specifically on BEVs. Battery Electric vehicles are available in a variety of styles and sizes ranging from sedans and SUVs to Hummers and sports cars (Corvette 2023) and now pickup trucks (Ford F-150 Lightening and Tesla Cybertruck).
Hydrogen Fuel Cell - A hydrogen fuel cell can also be used to produce electric power. Similar to electricity, hydrogen is not a fuel but and energy carrier. It takes energy to extract the hydrogen from the molecular structure of other resources (natural gas, coal, etc.) or to electrically split water into hydrogen and oxygen. If the resources to accomplish this are not carbon-neutral then the hydrogen produced is not either. The hydrogen infrastructure is much less developed. With some exceptions, most auto manufacturers have focused on battery electrics.
What are kilowatts, kilowatt-hours, MPGe
There are several terms that are useful in understanding electric vehicles.
Kilowatt (kW) - A kilowatt (1000 watts) is a measure of electric power. In electrical terms, one watt is one amp per second flowing across a potential difference of one volt. In household use, a kilowatt is used to describe the power required to operate a light fixture or power an appliance. In an EV, kilowatts are used to describe the power supplied by the electrical system to power the car or to recharge the battery.
Kilowatt Hours (kWh) - A kilowatt hour is a measure of energy. A kilowatt hour is equivalent to one kilowatt of power sustained for one hour. A monthly utility bill is measured in kilowatt-hours. In an EV, kilowatt hours may be used to characterize the energy capacity of a battery pack (e.g., 66 kWh) or the total energy required to travel a certain distance (e.g., 29 kWh per 100 mi).
Miles per Gallon equivalent (MPGe) - Miles per gallon gasoline equivalent (MPGe) is a measure of the average distance traveled per unit of energy consumed. MPGe is used by the EPA to compare energy consumption of battery electric vehicles with the energy consumption of conventional internal combustion vehicles that are rated in miles per U.S. gallon. MPGe is similar to MPG, but instead of presenting the miles per gallon of the vehicle’s fuel type, it represents the number of miles the vehicle can go using a quantity of fuel with the same energy content as a gallon of gasoline. The energy content of 1 U.S. gallon of gasoline is 33.7 kWh (Wikipedia, 2022).
Each new vehicle sold in the U.S. is required to display an EPA Fuel Economy sticker. In the sample sticker (2021 Bolt) the car can travel 118 miles on the energy content (33.7 kWh) of 1 gallon of gas in combined city and highway driving. The energy required to drive 100 miles (29 kWh) is also displayed.
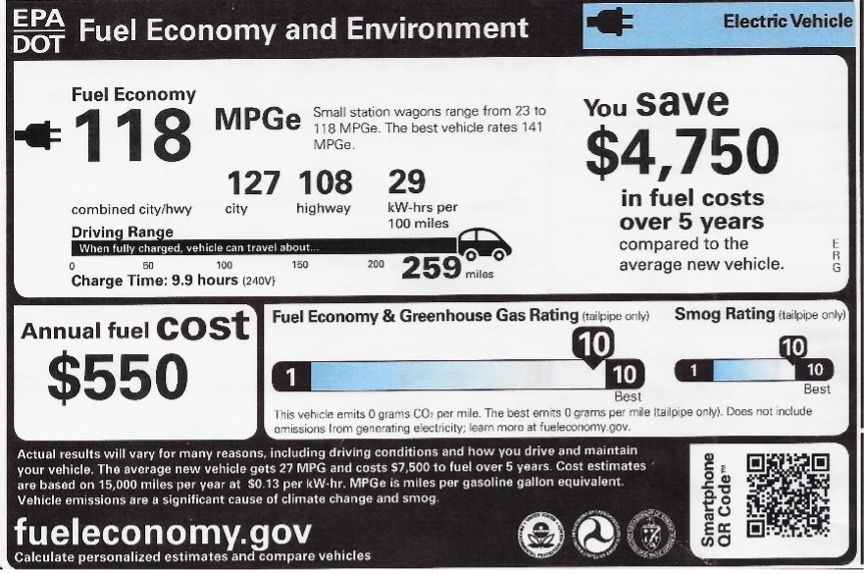
EPA Fuel Economy Sticker for a 2021 Chevrolet Bolt
(note that the gasoline price at the time was $2.70/gal!)
What is the electric car driving/owning experience?
Electric car owners are enthusiastic regarding the EV driving experience. The battery pack is placed under the floorboard giving a low center of gravity which enhances maneuverability and cornering. The combination of torque and power offered by the electric drive train offers outstanding performance. For example, 0-60 mph times for Tesla’s most popular car, the Model 3, range from 3.5 sec (Model 3 Performance) to 5.1 sec (Model 3 Long Range) (Dorian). Ford’s 150-Lightening pickup truck boasts an 0-60 mph time of 4.4 seconds and up to 10,000 lbs. of towing capacity (Runkle). The somewhat pedestrian Chevrolet Bolt 0-60 mph time is still 6.5 seconds (Car Indigo Chevrolet Bolt). All battery EVs are exceptionally quiet. Higher-end models offer the full range of styling, safety features, and infotainment systems as would be expected at those price levels including features such as semi-autonomous driving.
Because electric vehicles have fewer parts and less complicated systems (no internal combustion engine or transmission) they are simpler to maintain and repair. There are no scheduled oil changes for example. The most expensive part of an EV is the battery system. EV batteries are required to have an 8-year 100,000-mile warranty. While experts estimate the average EV battery will last around 200,000 miles, some manufacturers already promise much more than that (EV Connect).
Do electric cars really help the environment if the electricity generation is not green?
There are two types of emissions – vehicle tail pipe emissions and upstream emissions (Dept of Energy - GHG Emissions for BEV and PHEV Vehicles):
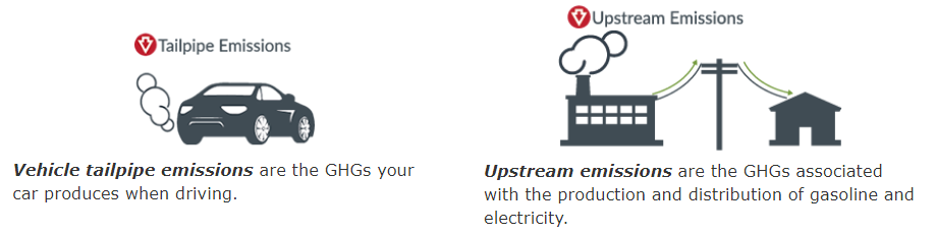
Vehicle tailpipe emissions – Vehicle tailpipe emissions are the greenhouse gas emissions a car produces when driving. Fully electric vehicles (EVs) have zero tailpipe emissions, while plug-in hybrid electric vehicles (PHEVs) emit greenhouse gases only when gasoline is being used to power the vehicle.
Gasoline engine tailpipe emissions - Every gallon of gasoline consumed produces 19.59 lbs. of Co2 (EPA - GHG Emissions). This somewhat surprising result is easily calculated. A gallon of gasoline weighs approximately 6.3 lbs. and is 87% carbon and 13% hydrogen so the weight of the carbon is 5.5 lbs. The carbon in the fuel combines with the oxygen in the atmosphere to form CO2. Carbon has an atomic weight of 12 and oxygen has an atomic weight of 16. The relative weight of CO2 to carbon is (12+2x16)/12 or 3.67. The CO2 produced when a gallon of gas is consumed is (5.5 x 3.67) or 19.59 lbs./gal. A gasoline powered vehicle driven 15,000 miles a year, averaging 27 mi/gal, will produce 10,833 lbs. of CO2 over the course of a year.
Upstream emissions – Upstream emissions are the emissions associated with the production and distribution of gasoline and electricity. This includes activities like resource extraction (e.g., drilling for oil or mining coal), transport to a processing plant, conversion to fuel or electricity, and the distribution of the fuel or electricity. Pipeline distribution of crude oil and gasoline also contributes to upstream CO2 emissions. Electricity emissions depend on the mix of resources (wind, solar, hydro, nuclear, coal, gas) used to generate electricity in a particular region.
The site www.fueleconomy.gov has numerous resources and calculators for assessing emissions and economics for conventional and alternate fuel resource. One calculator, Beyond Tailpipe Emissions (fueleconomy.gov) allows a vehicle-specific and locality-specific assessment of total emissions (tailpipe and upstream) emissions. Typical results are shown for a Chevrolet Bolt (Dept of Energy - GHG Emissions for BEV and PHEV Vehicles)
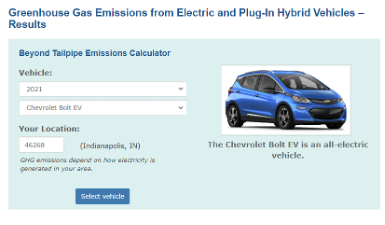
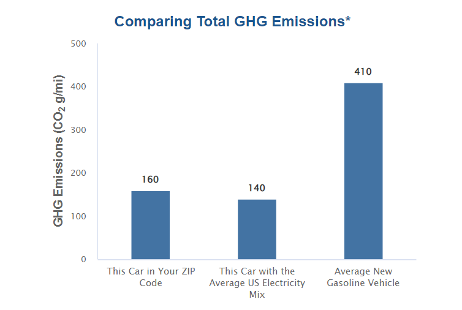
EV results are compared with an average new gasoline vehicle averaging 27 mpg and include a national-average factor of 1.25 applied to gasoline tailpipe emissions to account for upstream emissions associated with gasoline production.
The calculator shows that, with the existing local resource mix, the Bolt EV produces only 39% of the total emissions of an average gasoline powered vehicle. This will continue to improve as the local power mix becomes greener. The AES 2019 Integrated Resource Plan shows that the 2019 AES resource mix was 43% coal, 45% natural gas, and 8% wind and was projected to be 28% coal, 47%, natural gas, 11% wind, and 15% solar in 2023 (AES Indiana Integrated Resource Plan, 2019). AES recently made a commitment to phase out coal (the fuel source with the highest greenhouse gas emissions) by 2025 (Bowman, 2022).
What About Range Anxiety?
Studies have shown that driving range and lack of charging infrastructure are the primary limiting reasons that people do not consider EVs when purchasing a new vehicle. However, EV ranges are steadily increasing. Consumer Reports provides a list of EPA-rated ranges (Consumer Reports, 2022).
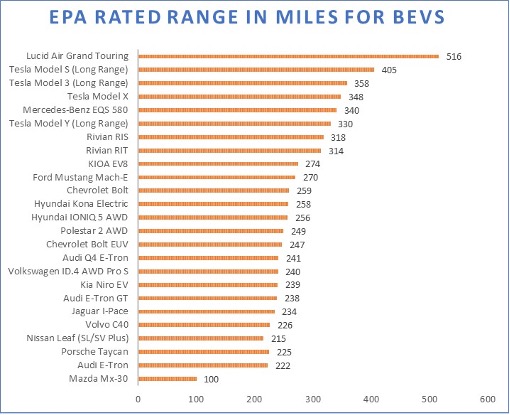
AAA (American Auto Association, 2019) reports that the average American drives 31 miles per day so even a limited range vehicle would support typical day-to-day driving. Most range anxiety is triggered by long distance driving and the ability to find a charging station and then to charge in a timely matter. Many consumers begin to feel comfortable with a range of 250 miles and up and, as the chart shows, that there are many EV choices that meet this criterion.
Another concern is winter driving in which range decreases. There are two primary reasons that EV range/milage goes down in winter as temperatures drop (Witt, 2021).
- Chemical and physical reactions occur more slowly in cold weather reducing the EV’s battery power.
- Electric cars have to make their own heat. An internal combustion engine redirects waste heat from the engine to warm this cabin. A typical gasoline engine has a thermal efficiency of 30%-35% - the rest of the energy is otherwise lost as heat (American Auto Association - Engine Efficiency). An electric motor, in contrast, has an efficiency of 85%-90% (Hanley, 2018) and thus has to use additional electric power to warm the cabin either through resistance heating or, more efficiently, through a heat pump.
EPA milage ratings are determined by running the vehicle on a dynamometer simulating 5 test cycles {city, highway, high speed, A/C, and cold temperature (20◦ F)} (EPA - MPG Test Procedure). Since the EPA milage ratings are a blend of the 5 test cycles, driving exclusively in cold weather may result in milage lower than the EPA ratings. The figure below from Recurrent shows the effect of temperature as aggregated from data from 7000 cars in the Recurrent community in the U.S.
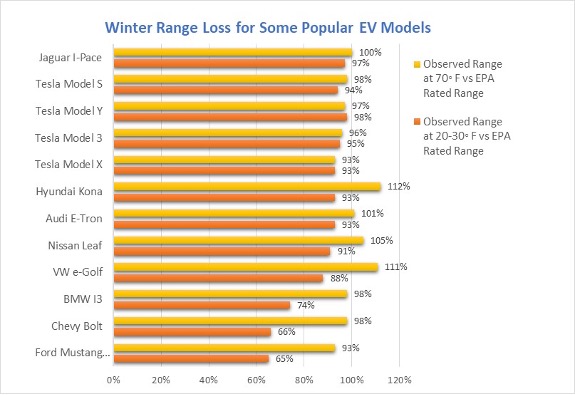
Differences may be attributed to type of heating (resistance heat vs heat pump, better use of the battery management system, greater use of the heated seats/steering wheel vs cabin air, etc.). A typical gasoline car’s gas milage is also roughly 15% lower at 20◦ F vs 77◦ F due to increased tire rolling resistance, colder more dense air, more idling, higher viscosity oil (Dept of Energy - Fuel Economy in Cold Weather). The reduction is more noticeable in an EV since the driver’s display always shows the estimated remaining range. In any event, a temporary reduction in colder conditions has virtually no impact on every day driving.
How does EV charging work?
There are three levels of electric charging (Dept of Energy - Charging Options)
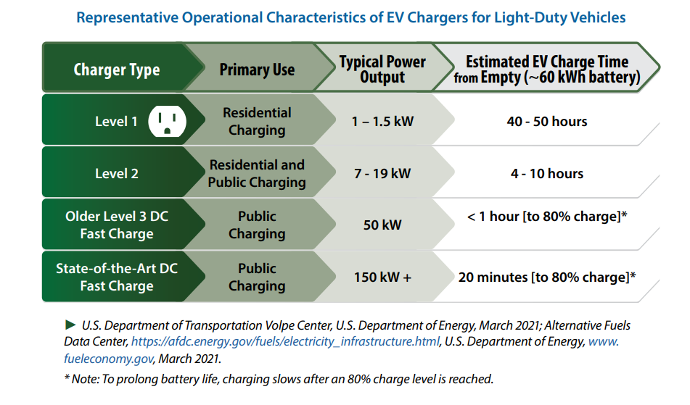
Level 1 - A level 1 charger plugs directly into a standard 120-volt outlet. AC current is provided to an on-board charger which charges the battery at 1-1.5 kW power adding 2-5 miles of range per hour. This level is sufficient for a PHEV vehicle or an EV that is not driven long distances on a daily basis.
Level 2 - A level 2 charger, if installed at home, requires an upgrade to a 240-volt outlet and installation of a charger. The wall mounted charger still provides AC current to the on-board charger that charges the battery at a higher power rate of 7-19 kW and adds 10-20 miles range per hour of charging.

Typical Level 2 Charger
Level 2 charges are appropriate for EV’s in residences and public spaces (work, apartment, condo, public charging stations) where the car may be left for the time necessary to charge sufficiently before use. More than 80% of EV charging occurs at either home or work. The process for charging a car with a level 1 or level 2 charger is identical to the process for charging a smartphone.
Level 3 - Level 3 chargers apply direct current (DC) directly to the battery management system (skipping the on-board charger) at much higher power levels (50kW to 150kw or more). A Level 3 charging station more closely approximates the gasoline service station experience typically filling a fully discharged battery to 80% charge in times ranging from 20 minutes to 1 hour. Level 3 stations are public stations with limited availability though they are becoming more common.
Tesla has the largest network of Level 3 chargers (Supercharger Network) with 1330 charging stations in U.S. (ScrapeHero). Tesla advertises charging rates up to 250 kW adding up to 200 miles range in 15 minutes (Tesla - Supercharger). All Tesla vehicles use a proprietary charging plug different from other automakers and a connector is required to charge at a Tesla charging station. Tesla has announced plans to open the Supercharger network to non-Tesla vehicles. Numerous other electrical charging companies that compete with Tesla include ChargePoint, Electrify America, Volta, eVgo, Sema and others.
Virtually all EV’s provide a mapping application either through the vehicle display or a smartphone app that provides the location of nearby charging stations and provides route planning assistance with charging locations in mind.
Does purchasing/renting an EV make economic sense?
EVs can be either rented on a monthly basis or purchased.
Rental - Motor Drive (an AES subsidiary) offers a monthly subscription service for a variety of electric vehicles (Tesla, VW, Ford, Audi, and Nissan) (Motor). The monthly subscription service offers the ability for people to try an electric vehicle while still maintaining flexibility. Motor offers a pathway to ownership if the subscribers choose to purchase.
Purchase – Consumer Reports provides a list of representative electric vehicles in various price ranges. (Consumer Reports, 2022)
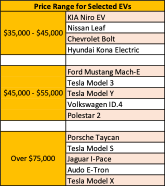
EV prices should be viewed within the context of the record high average of all new car sales prices ($47,000) as reported by Kelly Blue Book in Dec 2021 based upon final transaction prices (Tucker, 2022). This large increase reflects high demand, supply chain issues, chip shortages, and a shift to more profitable luxury vehicles given the limited supply of chips and other critical parts.
Federal Tax Credit – Electric and Plug-in Hybrid cars purchased new may be eligible for a federal income tax credit of up to $7,500 (Dept of Energy - Fed Tax Credits). The credit amount will vary based on the capacity of the battery used to power the vehicle. The credit phases out after a manufacturer has sold more than 200,000 plug-in vehicles – Tesla and Chevrolet are no longer eligible for the credit. The website Federal Tax Credits for All-Electric and Plug-in Hybrid Vehicles (fueleconomy.gov) provides a list of current model eligibility. A tax credit reduces the amount of income tax owed and so effectively reduces the purchase price of an eligible vehicle by the amount of the credit.
Cost to install Level 2 Charger – Level 2 home charger units generally cost between about $400 and $1,000. Installation costs depend on the electrician, the complexity of the installation, and any permits or other fees that are required. The writer’s personal experience was about $650 each for the charger and installation.
Energy/Fuel Cost – Energy/fuel costs for an electric vehicle and a gasoline engine are dramatically different particularly given the recent steep rise in fuel costs due to increased post-pandemic demand and geopolitical tensions arising from the war in Ukraine.
The following charts shows the yearly energy cost (assuming 15k miles/year) for operating two typical electric vehicles (Chevy Bolt and Tesla Model 3) compared to an average new gasoline car with a 27 MPG rating. In Indianapolis, the gasoline-powered vehicle energy cost is 5 times higher than an electric vehicle. As an example, the Tesla Model 3 LR will travel 131 miles on the energy content (33.7 kWh) of one U.S. gallon. At the AES residential rate of $0.12 kWh, the cost would be $4.04. An average new car with a 27 MPG average would require 4.85 gallons of gas to cover the same distance. To equal the EV cost, the gasoline would need to cost $0.83/gal (vs. current $4.17/gal Indiana average for regular gas).
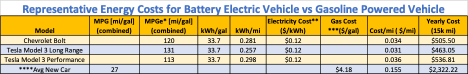

The above calculations are based upon AES residential energy rates and include taxes to compare with gasoline prices which include a fuel tax.
If a public charging station is utilized the electricity cost will likely be higher. Charging rates are determined by the station owner and not by the charging network and may vary from station to station Some stations charge by the hour or minutes charged and others may charge by the kWh provided. Typical rates for one large network provider, ChargePoint, are $2 - $3 per hour (Solar Reviews, 2021). For a typical level 2 charging rate of 7.6 kW - this works out to $0.26 to $0.39 per kWh. Tesla charges $0.28 kWh to use its Superchargers (Mach1). Even though public charges are more expensive than the residential charging rate ($0.12 kWh) they are clearly cheaper than the gasoline option.
Are EV’s safe?
Electric vehicles are required to meet the same safety and crashworthiness standards as conventionally powered vehicles. The National Highway Traffic Safety Administration (NHTSA) and the Insurance institute for Highway Safety (IIHS) conduct a wide range of tests including frontal, side, and rollover crashes as well as crash avoidance. EV models do well in these tests. The Tesla Model 3 receive a five-star rating from the NHTSA in all categories tested and was also awarded a Top Safety+ Pick from the IIHS. The Chevrolet Bolt was awarded 5 stars in side and rollover protection and 4 stars on frontal collision (Versaw, 2022). The IIHS awarded the Volvo XC 40 Recharge and the Ford Mach-E Top Safety Pick+ ratings (Insurance Inst of Highway Safety, 2021).
Compared to a conventional ICE, an EV’s lower center of gravity and heavier weight (due to the battery) make it less likely to rollover and its occupants exposed to lower forces upon impact. One study looks at electric and conventional versions of nine models from 2011 to 2019 and found that injury claims related to the drivers and passengers of electric vehicles were more than 40 percent lower than for identical conventional models (Insurance Inst of Highway Safety, 2021). Evidence shows that electric vehicles are at least as safe as conventional vehicles.
Virtually all electric vehicles rely on lithium-ion batteries. Lithium-ion battery cells have closely spaced electrodes and are filled with a flammable liquid electrolyte. Available data show that electric vehicle fires are rare. Research by AutoinsuranceEZ, shows that electric vehicles experienced significantly fewer fires (25 fires per 100,000 vehicles) compared to internal combustion engine vehicles (1,529 fires per 100,000 vehicles) (AutoInsuranceEZ, 2022). However, when fires do occur, electric vehicles with lithium-ion batteries burn hotter, faster, and require more water to reach final extinguishment and in some cases may reignite. As EVs become more prevalent, first responders are adapting firefighting techniques to address these differences.
In 2020-2021 the battery maker LG Chem was in the news as a result of defects in batteries that were provided to a number of manufacturers. Impacted models include the Chevrolet Bolt EV, Hyundai Kona and Ioniq Electric, Chrysler Pacifica Hybrid, and Volkswagen ID.4 (InsideEVs, 2022). Some fires were also reported on the Tesla Model S Plaid which does not use LG Chem batteries. In the case of the Bolt, 16 fires out of 140,000 vehicles were reported and model production was temporarily halted (Berman, 2021). The cause was traced to a rare manufacturing defect. All batteries have been recalled and are being replaced with improved defect-free cells.
Battery safety is addressed both by battery chemistry, battery design, and manufacturing processes. Improved battery cell chemistry is an area of intense research to improve safety, sustainability, performance, and durability. Notably manufacturers are exploring a transition away from lithium- nickel-manganese-cobalt cathode materials to lithium-iron phosphate (Ewing & Lipton, 2022) or graphene-aluminum cathode materials (Taylor, 2021) - both have a lower fire risk. Work is also ongoing to replace the flammable electrolyte with a solid electrolyte which is nonflammable (Ewing & Lipton, 2022).
What will the future public charging infrastructure look like?
The Department of Energy’s Alternate Fuels Data center maintains a list of alternate fuel sites. In April 2022, there were 47,222 publicly-available level 2 or level 3 EV charging station locations nationwide with 117,222 charging ports (Dept of Energy - EV Charging Locations). In Indiana, there were 321 station locations with 899 charging ports. These numbers do not currently include Tesla proprietary stations. It’s clear that this number will need to grow rapidly to accommodate the widespread adaption of electric cars even with a majority of charging still occurring at home.
Different studies reach different conclusions regarding the total number of non-residential chargers (charging ports) required by the 2030 timeframe – one study suggests that 2.4 million public chargers will be required (Bauer, Hsu, Nicholas, & Lutsey, 2021). While the bulk of the EV charging infrastructure will be funded by private enterprise, there is a role for government to play in jump starting and standardizing the process. The 2021 Infrastructure Law includes $7.5 billion for EV charging network development. $5 billion is included in formula funding for individual states with a goal to build a national charging network. 10% is set-aside each year for grants to states to help fill gaps in the network. The law also provides $2.5 billion for communities and corridors through a competitive grant program to ensure that charger deployment meets priorities such as supporting rural charging, improving local air quality, and increasing EV charging access in disadvantaged communities (The White House, 2021). As estimated by CleanTechnica, $7.5B in EV charging stations funding could result in around 1,900 highway and rural stations, 100,000 urban stations, and 215,000 Level 2 stations for workplaces, apartments, and airports (Sensiba, 2021).
Locally, the governors of Illinois, Indiana, Michigan, Minnesota and Wisconsin signed a memorandum of understanding, Regional Electric Midwest Coalition MOU, to support the development of an infrastructure for charging vehicles in the Midwest (Chappell, 2021). The plan aims to improve the region’s economy while also reducing emissions. It will help the Midwest to compete for both private and federal funding. The plan promises to make it easier to find charging stations and reduce range anxiety.
LINK TO ENTIRE ARTICLE WITH REFERENCES.
Rick Newsome, Blog Contributor for the Creation Care Ministry